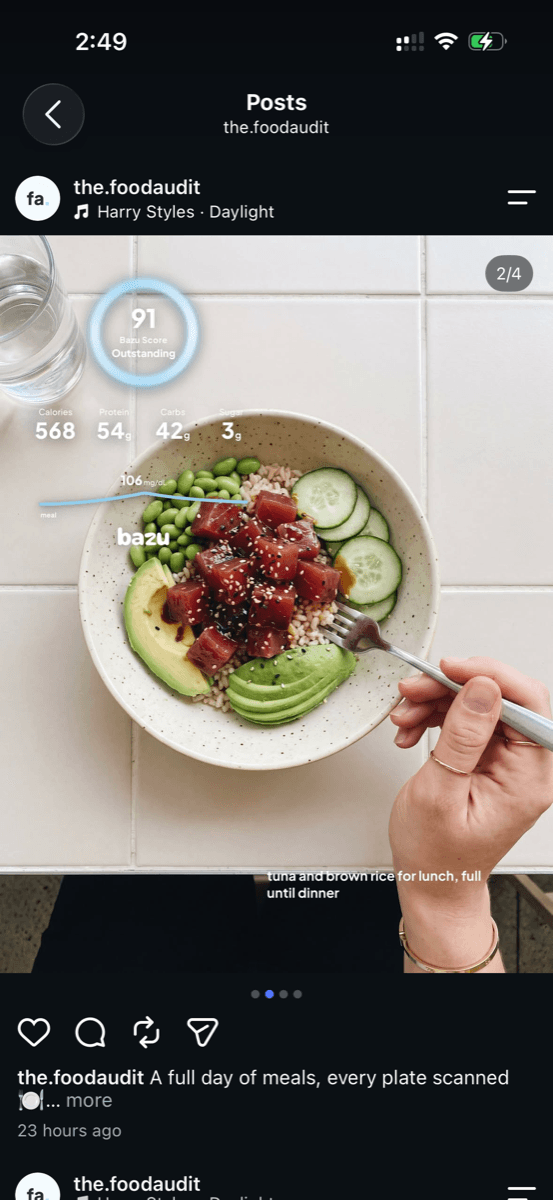
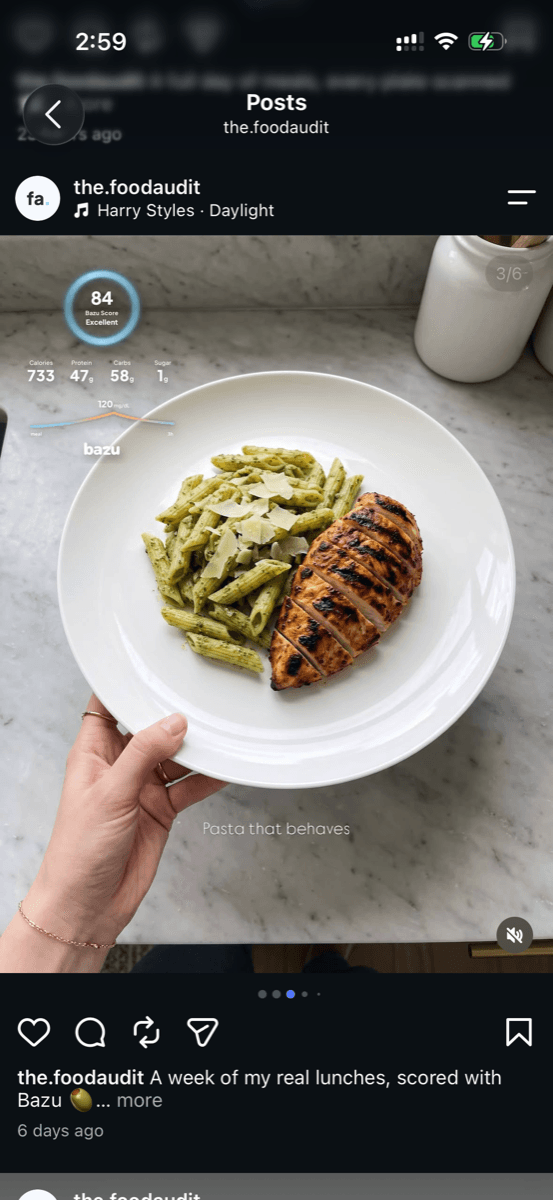
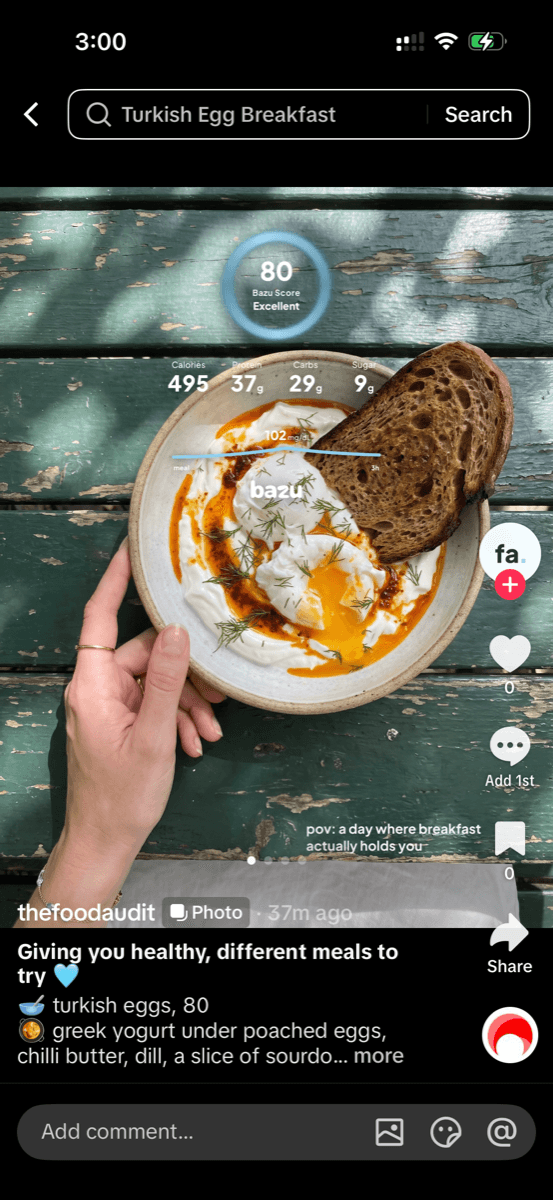
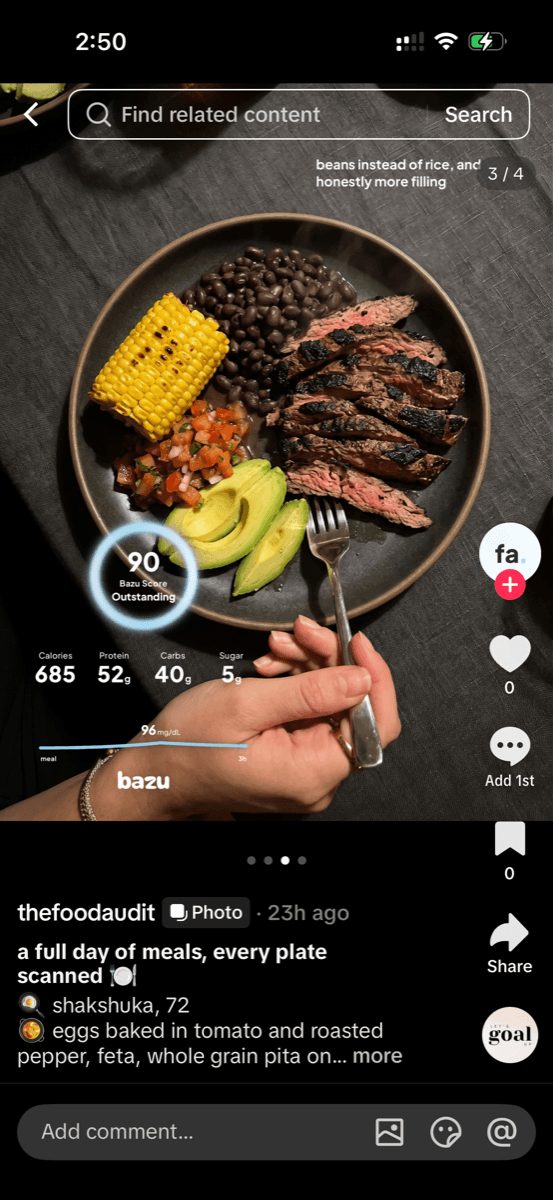
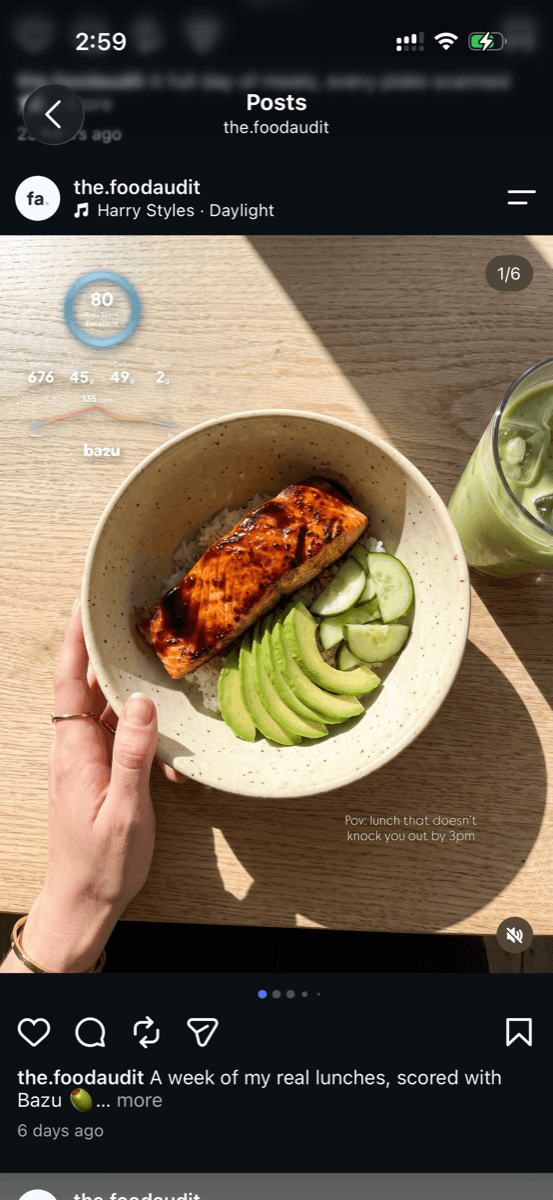
No monitor. No finger pricks.
How Bazu draws your glucose curve
Log a meal and watch blood sugar rise and settle across the day, predicted from the food itself.
What it is
A full day of blood sugar, shaped by your food
Bazu draws a 24-hour line of how blood sugar likely rises and settles, predicted from the meals you log and the body's natural daily rhythm.
Your Bazu estimated glucose curve
mg/dL
An estimate from your meals. Not a medical reading.
What shapes the curve

Your meals
Each meal adds a peak. Faster carbs and bigger portions push it higher. Fiber, fat, and protein blunt it.
Time of day
Your body has a natural rhythm: lowest around 3am, a small rise at dawn, then a steady plateau through the day.

Your basics
Age nudges the baseline up a little after 60. We don't model exercise, stress, sleep, or medications yet.
Without a monitor
No monitor? We estimate it from your food.
No sensor, no finger pricks. Bazu builds your day from the meals you log, a typical response, not yours, the shape and trend of your day rather than exact numbers.
A baseline rhythm
We start with a 24-hour curve from glucose research: low overnight, a small rise at dawn, a steady daytime plateau.
Each meal, read
We look at what shapes a peak in what you logged:
Each meal, predicted
Those numbers go into a published formula that works out how fast the carbs digest, then get bounded by measured ranges for that kind of food. Nothing is guessed at by an AI. That becomes a peak on the line: how high it climbs, how fast it gets there, how long it lingers.
Laid on your day
Meals sit on the baseline without stacking into impossible spikes. Solid where a meal shapes the line, dotted on the baseline, with a shaded band for how sure we are.
With a monitor
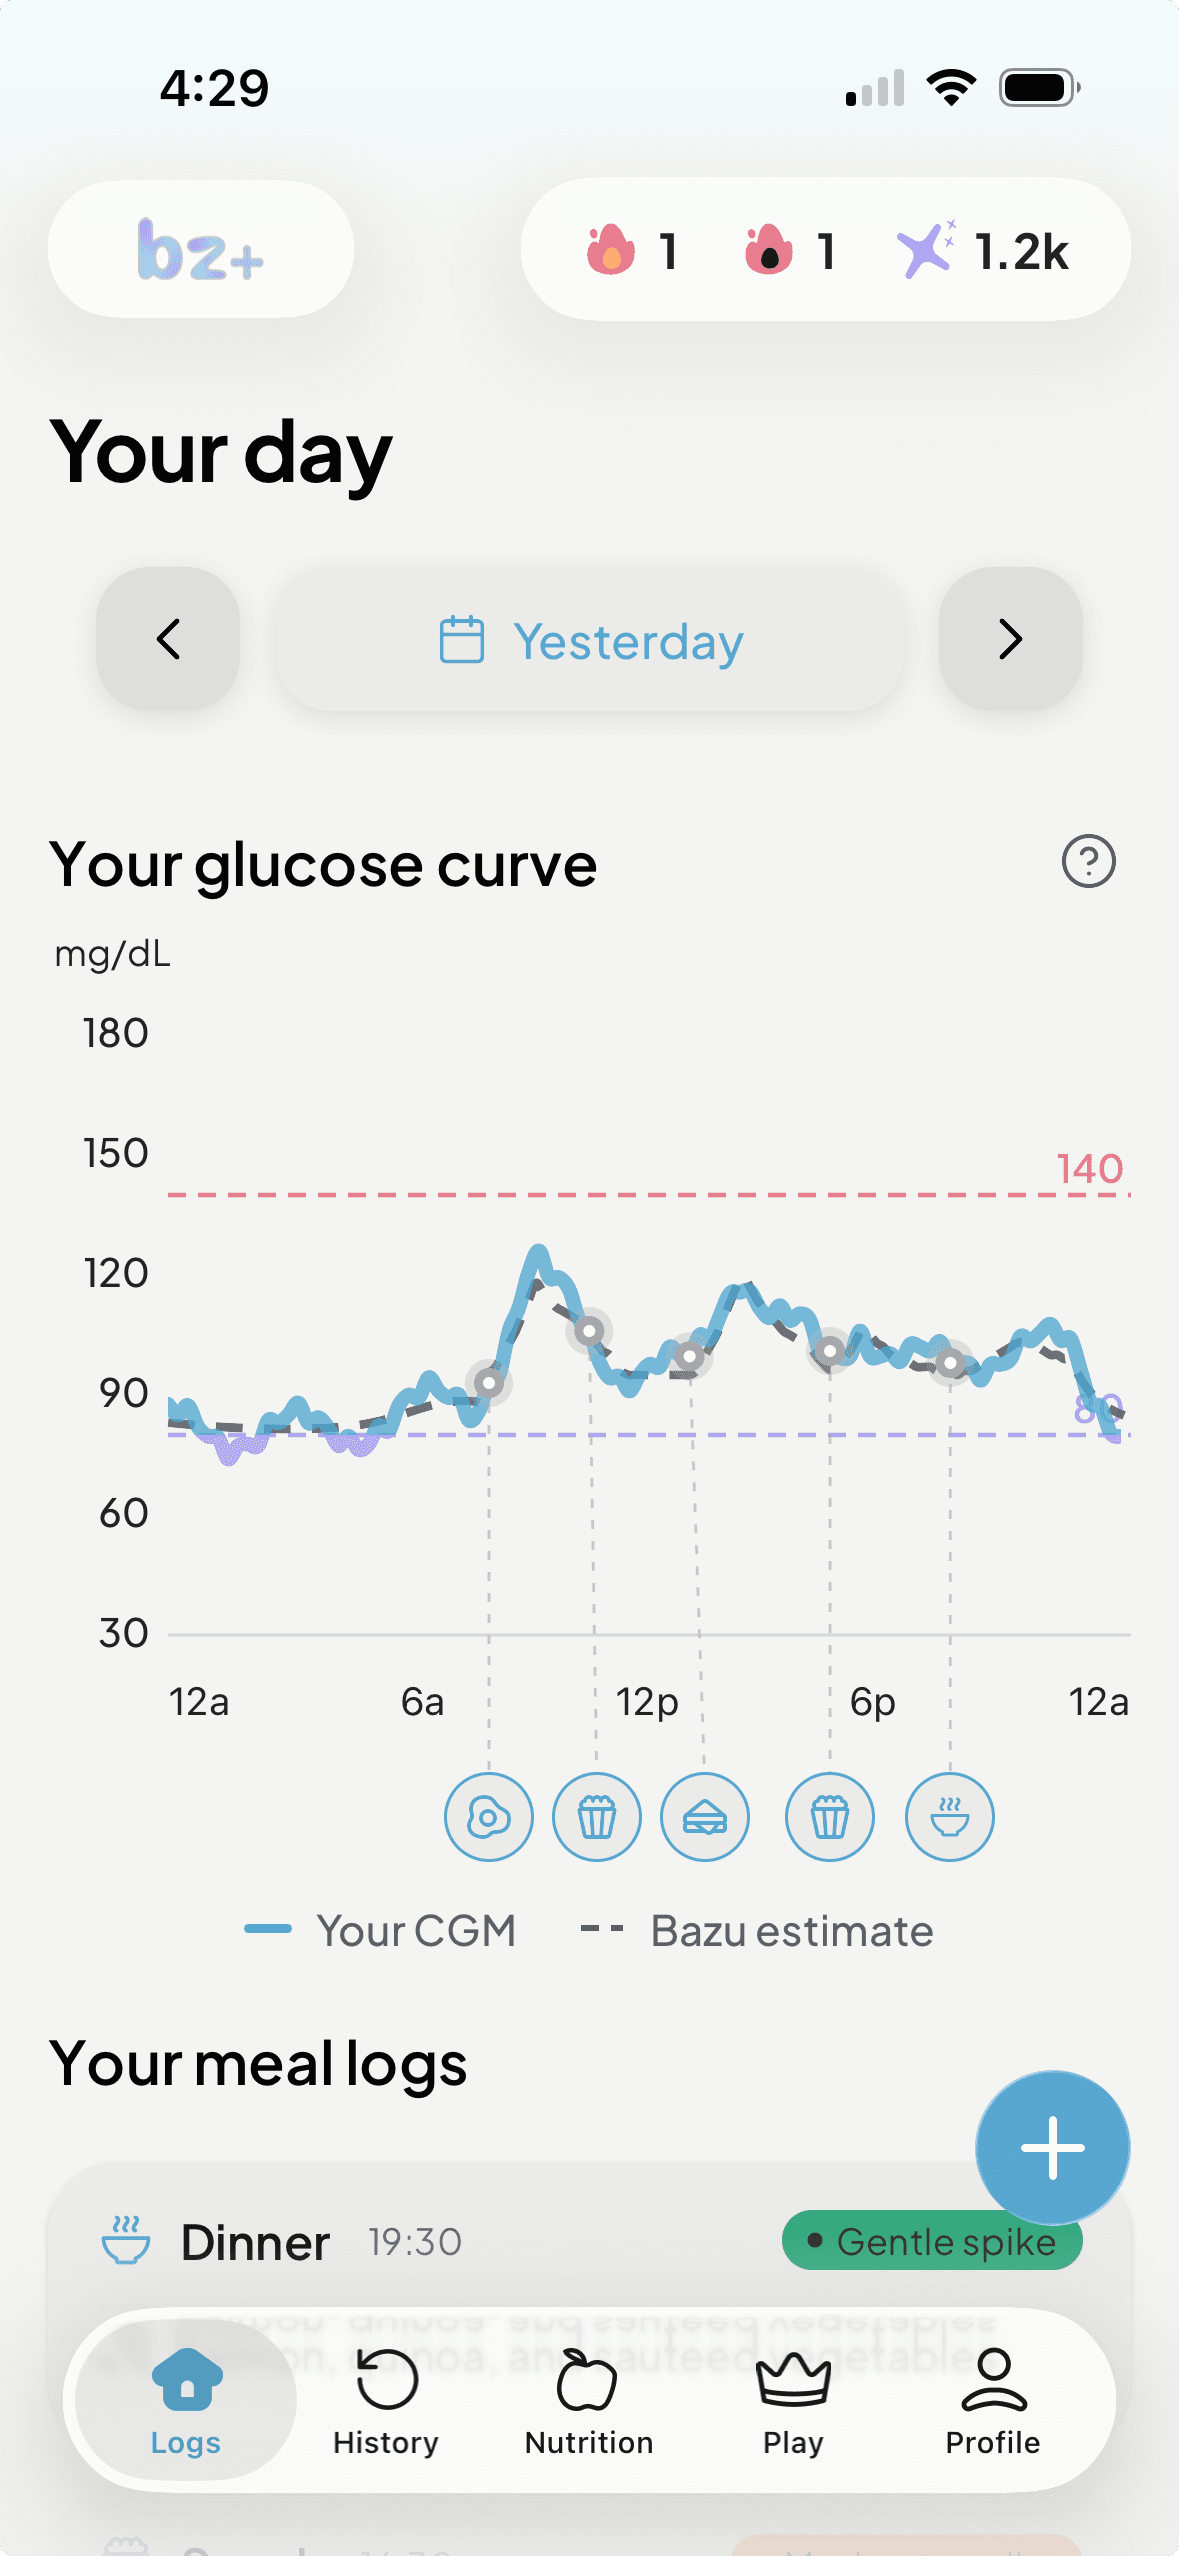
Got a CGM? You see the real thing.
Connect a CGM and the line becomes real, every point a sensor reading. We show the Bazu estimate right beside it, dashed, so you can see how closely the prediction tracks. Gaps appear when the sensor drops out. We never invent data.
Meal by meal
Every meal gets its own curve
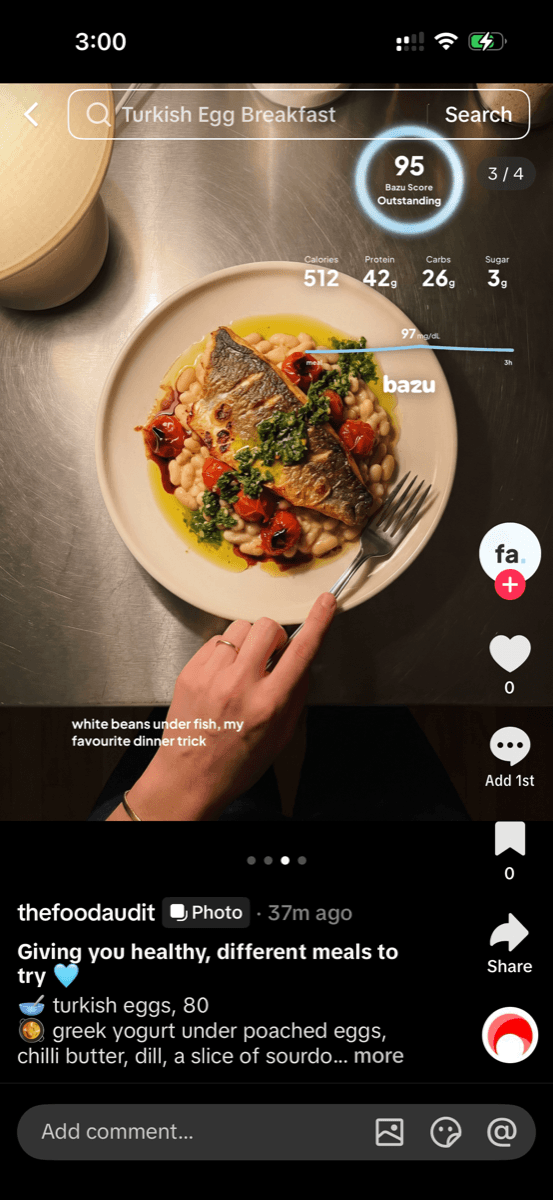
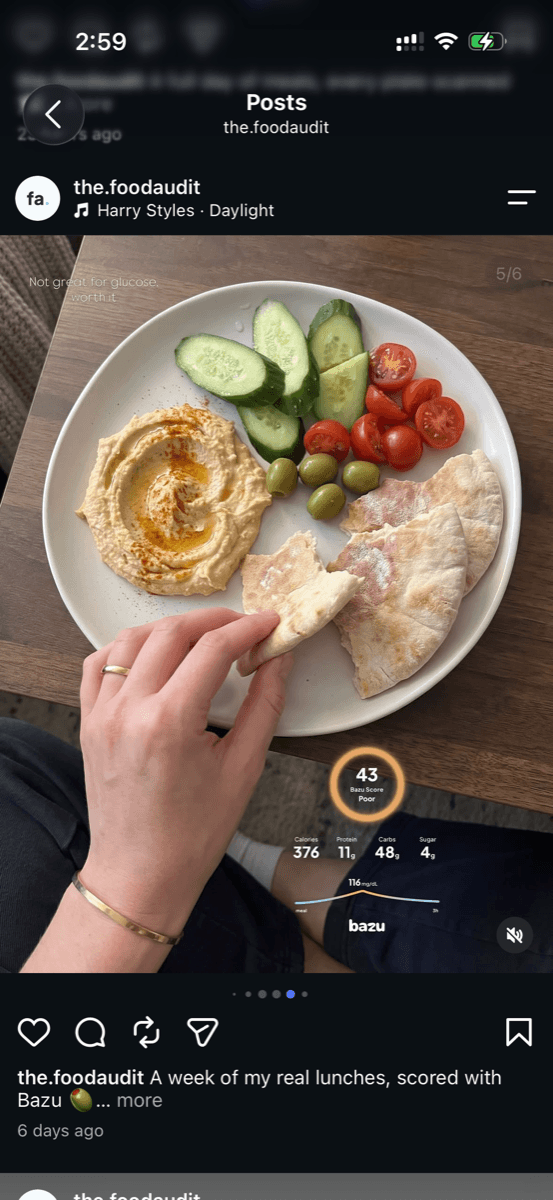
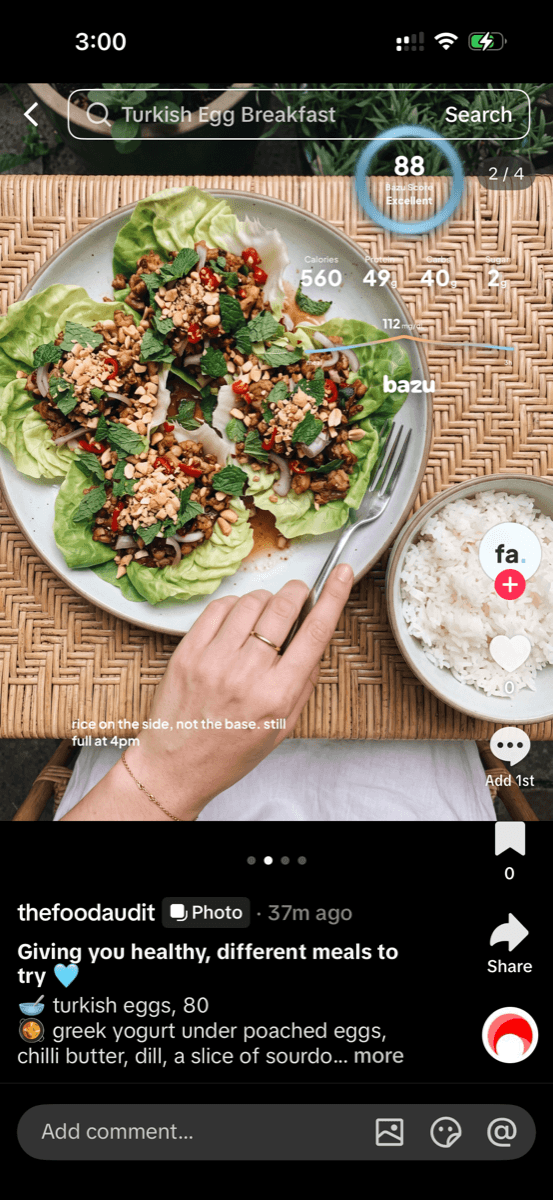
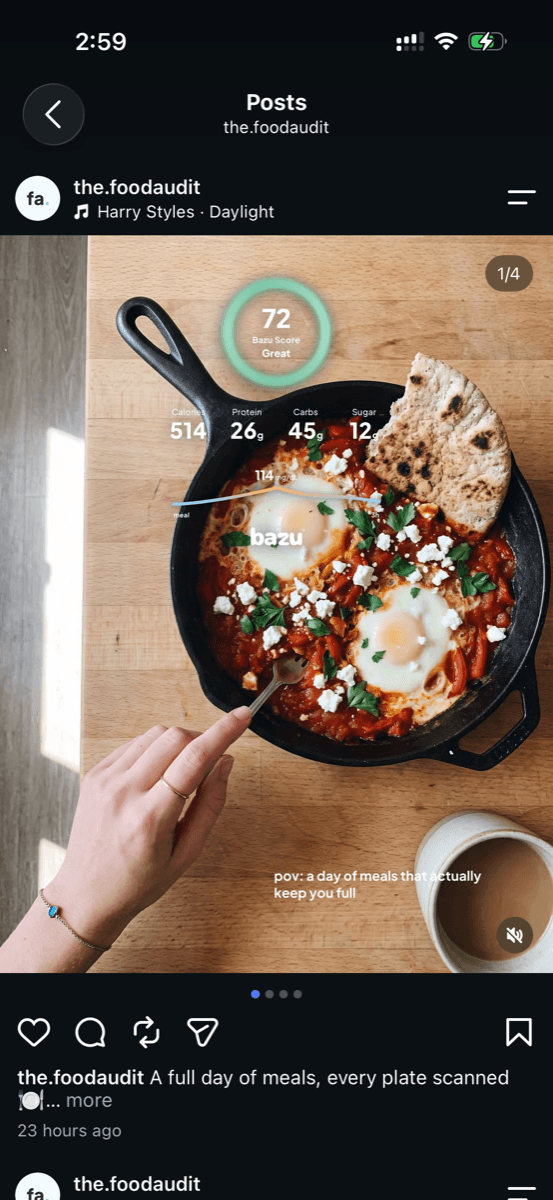
A fresh 3-hour curve for every meal you log, shaped by exactly what was on the plate.
Wear a CGM and log the same meal a few times, and Bazu draws your real average response next to its estimate.
The more you log, the more it reflects you, not just a typical plate.
Bazu's estimate vs your real curve
Your average is built from your CGM over time, a trend, not a single reading.
Who it's for
Who it's for, and who it's not

For you if…
You're healthy and glucose-conscious, and you want to see how food moves blood sugar, no monitor, no finger pricks.

Not for managing diabetes
If you have Type 1, Bazu turns the estimate off and shows a real CGM only, never a prediction. With pre-diabetes or Type 2, your real numbers likely run higher than our non-diabetic baseline.
Bazu is a general wellness tool. Not a medical device, not medical advice.

Backed by research
Built on real science, not a guess
The baseline comes from 24-hour glucose studies in non-diabetic adults. Each meal's curve, how high it rises and whether it dips or lingers, is modeled on a database of more than 1,000 foods measured in healthy people. The things Bazu helps you notice come from published research too.
A blood-sugar dip after a meal is linked to feeling hungry sooner.
A short walk after eating noticeably flattens the rise.
Eating veggies and protein before carbs lowers that meal's rise.
Diets high on the glycemic index are linked to higher heart-disease risk, even without diabetes.
Curve shapes from Brand-Miller 2009 (AJCN, 1,000+ foods). Baseline from Freckmann 2007, Bolli & Gerich 1984, and Shah 2019. Findings are framed as associations, not medical claims.
FAQ
Common questions
See the glucose curve, free
Scan any food, log your day, watch the curve come together